| Comments

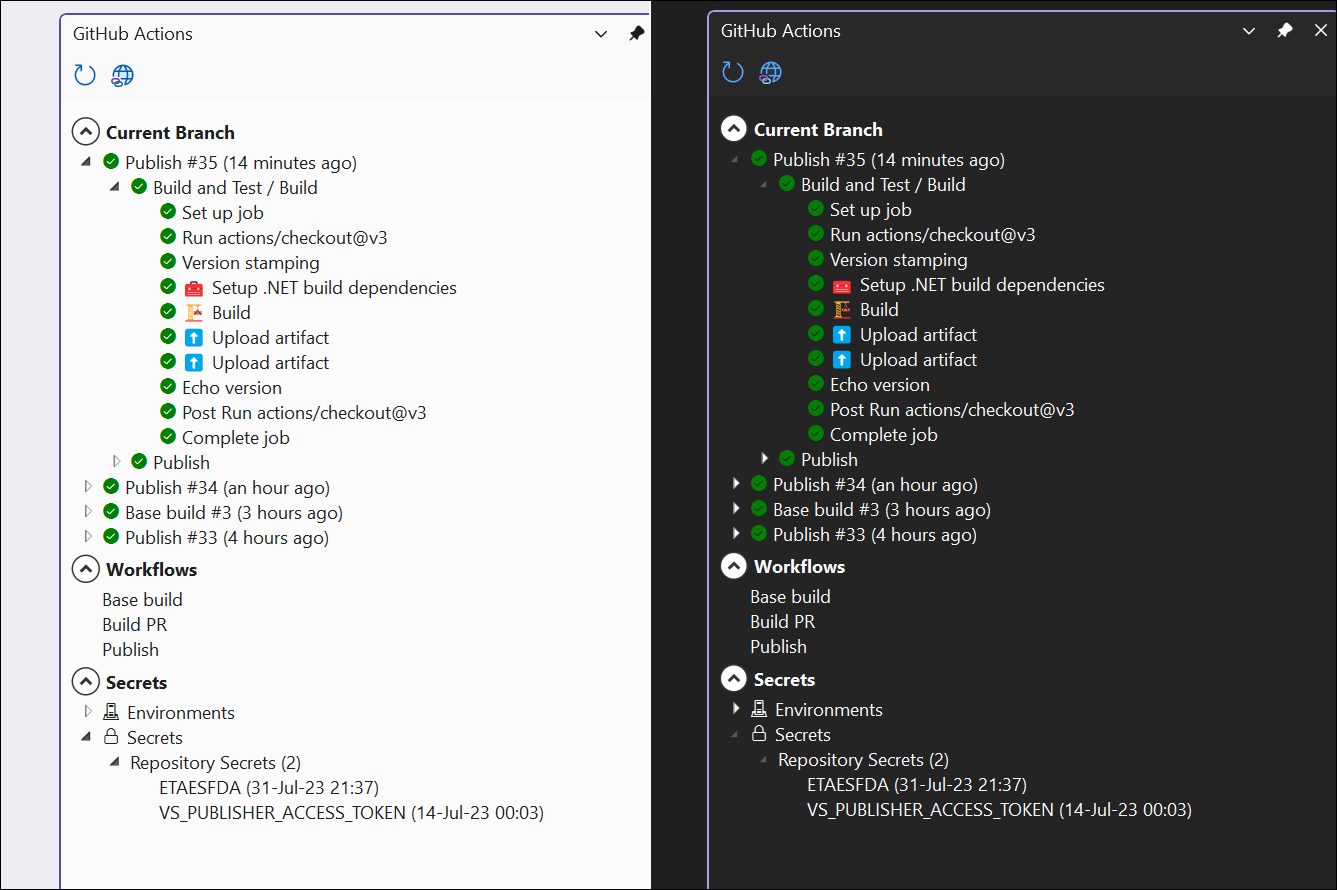
I LOVE GitHub Actions! I’ve written about this a lot and how I’ve ‘seen the light’ with regard to ensuring CI/CD is a part of any/every project from the start. That said I’m also a HUGE Visual Studio fan/user.  I like having everything as much as possible at my fingertips in my IDE and for most basic things not have to leave VS to do those things.  Because of this I’ve created GitHub Actions for Visual Studio extension that installs right into Visual Studio 2022 and gives you immediate insight into your GitHub Actions environment. 

Screenshot of light/dark mode of extension

Like nearly every one of my projects it starts as completely selfish reasons and tailored to my needs. I spend time doing this in some reserved learning time and the occasional time where my family isn’t around and/or it’s raining and I can’t be on my bike LOL. That said, it may not meet your needs, and that’s okay.

With that said, let me introduce you to this extension…

How to launch it

First you’ll need to have a project/solution open that is attached to GitHub.com and you have the necessary permissions to view this information. The extension looks for GitHub credentials to use interacting with your Windows Credential manager. From VS Solution Explorer, right-click on a project or solution and navigate to the “GitHub Actions” menu item.  This will open a new tool window and start querying the repository and actions for more information.  There is a progress indicator that will show when activity is happening.  Once complete you’ll have a new tool window you can dock anywhere and it will show a few things for you, let’s take a look at what those are.

Categories

In the tool window there are 4 primary areas to be aware of:

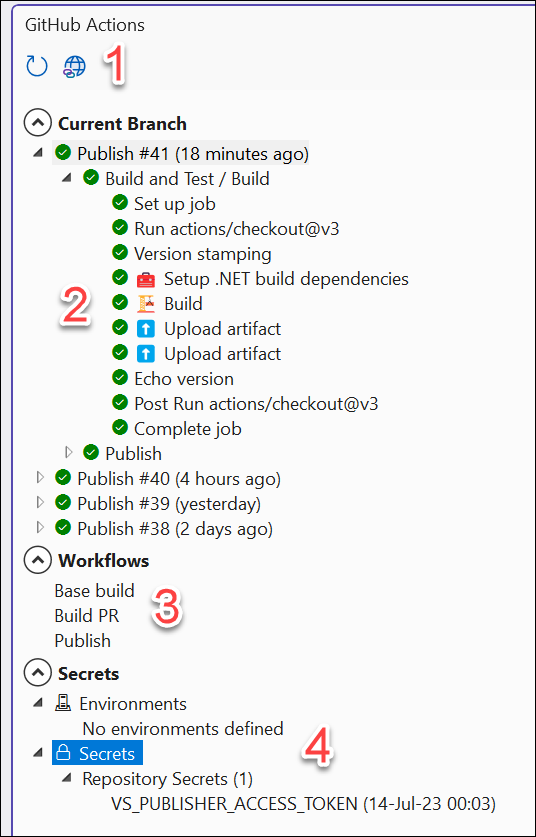
Screenshot of the tool window annotated with 4 numbers

First in the area marked #1 is a small toolbar.  The toolbar has two buttons, one to refresh the data should you need to manually do so for any reason. The second is a shortcut to the repository’s Actions section on GitHub.com.

Next the #2 area is a tree view of the current branch you have open and workflow runs that targeted that.  It will first show executed (or in-progress) workflow runs, and then you can expand it to see the jobs and steps of each job.  At the ‘leaf’ node of the step you can double-click (or right-click for a menu) and it will open the log for that step on GitHub.com directly.

The #3 area is a list of the Workflows in your repository by named definition. This is helpful just to see a list of them, but also you can right-click on them and “run” a workflow which triggers a dispatch call to that workflow to execute!

Finally the #4 area is your Environments and Secrets. Right now Environments just shows you a list of any you have, but not much else. Secrets are limited to Repository Secrets only right now and show you a list and when the secret was last updated.  You can right-click on the Secrets node to add another or double-click on an existing one to edit.  This will launch a quick modal dialog window to capture the secret name/value and upon saving, write to your repository and refresh this list.

Options

There are a small set of options you can configure for the extension:

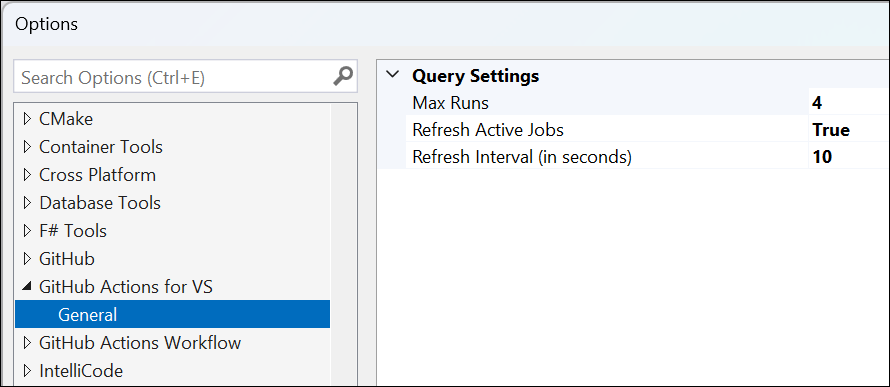
Screenshot of extension options

The following can be set:

  • Max Runs (Default=10): this is the maximum number of Workflow Runs to retrieve
  • Refresh Active Jobs (Default=False): if True, this will refresh the Workflow Runs list when any job is known to be in-progress
  • Refresh Interval (Default=5): This is a number in seconds you want to poll for an update on in-progress jobs.

Managing Workflows

Aside from viewing the list there are a few other things you can do using the extension:

  • Hover over the Run to see details of the final conclusion state, how it was triggered, the total time for the run, and what GitHub user triggered the run
  • If a run is in-progress, right-click on the run and you can choose to Cancel, which will attempt to send a cancellation to stop the run at whatever step it is in
  • On the steps nodes you can double-click or right-click and choose to view logs.  This will launch your default browser to the location of the step log for that item
  • From the Workflows list, you can right-click on a name of a Workflow and choose “Run Workflow” which will attempt to signal to run the start a run for that Workflow

Managing Secrets

Secrets right now are limited to Repository Secrets only.  This is due to a limitation the Octokit library this extension uses.  If you are using Environment Secrets you will not be able to manage them from here. 

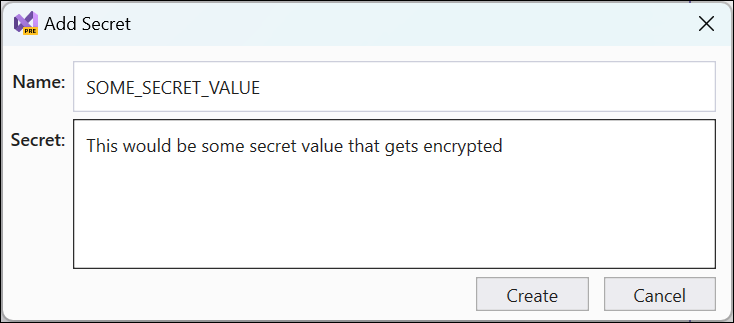
Screenshot of modal dialog for secret editing

Otherwise:

  • From the Repository Secrets node you can right-click and Add Secret which will launch a modal dialog to supply a name/value for a new secret. Clicking save will persist this to your repo and refresh the list.
  • From an existing secret you can double-click it or right-click and choose ‘Edit’ and will launch the same modal dialog but just enables you to edit the value only.
  • To delete a secret, right-click and choose delete. This is irreversible, so be sure you want to delete!

Get Started and Log Issues

To get started, you simply can navigate to the link on the marketplace and click install or use the Extension Manager in Visual Studio and search for “GitHub Actions” and install it.  If you find any issues, the source is available on my GitHub at timheuer/GitHubActionsVS but also would appreciate that you could log an Issue if you find it not working for you.  Thanks for trying it out and I hope it is helpful for you as it is for me.

| Comments

As I’ve been working more with Visual Studio Code lately, I wanted to explore more about the developer experience and some of the more challenging areas around customization.  VS Code has a great extensibility model and a TON of UI points for you to integrate.  In the C# Dev Kit we’ve not yet had the need to introduce any custom UI in any views or other experiences that are ‘pixels’ on the screen for the user…pretty awesome extensibility. One area that doesn’t have default UI is the non-text editors. Something that you want to do fully custom in the editor space. For me, I wanted to see what this experience was so I went out to create a small custom editor. I chose to create a ResX editor for the simplest case as ResX is a known-schema based structure that could easily be serialized/de-serialized as needed.

NOTE: This is not an original idea. There are existing extensions that do ResX editing in different ways. With nearly every project that I set out with, it starts as a learning/selfish reasons…and also selfish scope. Some of the existing ones had expanded features I felt unnecessary and I wanted a simple structure. They are all interesting and you should check them out. I’m no way claiming to be ‘best’ or first-mover here, just sharing my learning path.

With that said, I’m pleased with what I learned and the result, which is an editor that ‘fits in’ with the VS Code UX and achieves my CRUD goal of editing a ResX file:

Screenshot of ResX Editor and Viewer

With that, here’s what I’ve learned a bit…

Custom Editors and UI

There are a lot of warnings in the Custom Editor API docs of making sure you really need a custom editor, but point to the value of what they can provide for previewing/WYSIWYG renderings of documents. But they point to the fact that you will likely be using a webview and thus be fully responsible for your UI.  In the end you are owning the UI that you are drawing. For me, I’m not a UI designer, so I rely on others/toolkits to do a lot of heavy lifting. The examples I saw out there (and oddly enough the custom editor sample) don’t match the VS Code UX at all and I didn’t like that. I actually found it odd that the sample took such an extreme approach to the editor (cat paw drawings) rather than show a more realistic data-focused scenario on a known file format.

Luckily the team provides the Webview UI Toolkit for Visual Studio, a set of components that match the UX of VS Code and adhere to the theming and interaction models. It’s excellent and anyone doing custom UI in VS Code extensions should start using this immediately. Your extension will feel way more professional and at home in the standard VS Code UX.  My needs were fairly simple and I wanted to show the ResX (which is XML format) in a tabular format. The toolkit has a data-grid that was perfect for the job…mostly. But let’s start with the structure.

Most of the editor is in a provider (per the docs) and that’s where you implement a CustomTextEditorProvider which provides a register and resolveCustomTextEditor commands. Register does what you think, register’s your editor into the ecosystem, using the metadata from package.json about what file types/languages will trigger your editor.  Resolve is where you start providing your content. It provides you with a Webview panel where you put your initial content. Mine was a simple grid:

private _getWebviewContent(webview: vscode.Webview) {
  const webviewUri = webview.asWebviewUri(vscode.Uri.joinPath(this.context.extensionUri, 'out', 'webview.js'));
  const nonce = getNonce();
  const codiconsUri = webview.asWebviewUri(vscode.Uri.joinPath(this.context.extensionUri, 'media', 'codicon.css'));
  const codiconsFont = webview.asWebviewUri(vscode.Uri.joinPath(this.context.extensionUri, 'media', 'codicon.ttf'));

  return /*html*/ `
            <!DOCTYPE html>
            <html lang="en">
              <head>
                <meta charset="UTF-8">
                <meta name="viewport" content="width=device-width, initial-scale=1.0">
                <meta
                  http-equiv="Content-Security-Policy"
                  content="default-src 'none'; img-src ${webview.cspSource} https:; script-src 'nonce-${nonce}'; style-src ${webview.cspSource} 'nonce-${nonce}'; style-src-elem ${webview.cspSource} 'unsafe-inline'; font-src ${webview.cspSource};"
                />
                <link href="${codiconsUri}" rel="stylesheet" nonce="${nonce}">
              </head>
              <body>
                <vscode-data-grid id="resource-table" aria-label="Basic" generate-header="sticky" aria-label="Sticky Header"></vscode-data-grid>
                <vscode-button id="add-resource-button">
                  Add New Resource
                  <span slot="start" class="codicon codicon-add"></span>
                </vscode-button>
                <script type="module" nonce="${nonce}" src="${webviewUri}"></script>
              </body>
            </html>
          `;
}
}

This serves as the HTML ‘shell’ and then the actual interaction is via the webview.js you see being included. Some special things here or just how it includes the correct link to the js/css files I need but also notice the Content-Security-Policy. That was interesting to get right initially but it’s a recommendation solid meta tag to include (otherwise console will spit out warnings to anyone looking).  The webview.js is basically any JavaScript I needed to interact with my editor. Specifically this uses the registration of the Webview UI Toolkit and converts the resx to json and back (using the npm library resx). Here’s a snippet of that code in the custom editor provider that basically updates the document to JSON format as it changes:

private async updateTextDocument(document: vscode.TextDocument, json: any) {

  const edit = new vscode.WorkspaceEdit();

  edit.replace(
    document.uri,
    new vscode.Range(0, 0, document.lineCount, 0),
    await resx.js2resx(JSON.parse(json)));
  return vscode.workspace.applyEdit(edit);
}

So that gets the essence of the ‘bones’ of the editor that I needed. Once I had the data then a function in the webview.js can ‘bind’ the data to the vscode-data-grid supplying the column names + data easily and just set as the data rows quickly (lines 20,21):

function updateContent(/** @type {string} **/ text) {
    if (text) {

        var resxValues = [];

        let json;
        try {
            json = JSON.parse(text);
        }
        catch
        {
            console.log("error parsing json");
            return;
        }

        for (const node in json || []) {
            if (node) {
                let res = json[node];
                // eslint-disable-next-line @typescript-eslint/naming-convention
                var item = { Key: node, "Value": res.value || '', "Comment": res.comment || '' };
                resxValues.push(item);
            }
            else {
                console.log('node is undefined or null');
            }
        }

        table.rowsData = resxValues;
    }
    else {
        console.log("text is null");
        return;
    }
}

And the vscode-data-grid generates the rows, sticky header, handles the scrolling, theming, responding to environment, etc. for me!

Grid view

Now I want to edit…

Editing in the vscode-data-grid

The default data-grid does NOT provide editing capabilities unfortunately and I really didn’t want to have to invent something here and end up not getting the value from all the Webview UI Toolkit. Luckily some in the universe also tackling the same problem.  Thankfully Liam Barry was at the same time trying to solve the same problem and helped contribute what I needed.  It works and provides a simple editing experience:

Editing a row

Now that I can edit can I delete?

Deleting items in the grid

Maybe you made an error and you want to delete.  I decided to expose a command that can be invoked from the command palette but also from a context menu. I specifically chose not to put an “X” or delete button per-row…it didn’t feel like the right UX.  Once I created the command (which basically gets the element and then the _rowData from the vscode-data-grid element (yay, that was awesome the context is set for me!!).  Then I just remove it from the items array and update the doc.  The code is okay, but the experience is simple exposing as a right-click context menu:

Deleting an item

This is exposed by enabling the command on the webview context menu via package.json – notice on line 2 is where it is exposed on the context menu and the conditions of which it is exposed (a specific config value and ensuring that my editor is the active one):

"menus": {
  "webview/context": [
    {
      "command": "resx-editor.deleteResource",
      "when": "config.resx-editor.experimentalDelete == true && activeCustomEditorId == 'resx-editor.editor'"
    }
  ]
...
}

Deleting done, now add a new one!

Adding a new item

Obviously you want to add one! So I want to capture input…but don’t want to do a ‘form’ as that doesn’t feel like the VS Code way. I chose to use a multi-input method using the command area to capture the flow. This can be invoked from the button you see but also from the command palette command itself.

Add new resource

Simple enough, it captures the inputs and adds a new item to the data array and the document is updated again.

Using the default editor

While custom editors are great, there may be times you want to use the default editor. This can be done by doing “open with” on the file from Explorer view, but I wanted to provide a quicker method from my custom editor. I added a command that re-opens the active document in the text editor:

let openInTextEditorCommand = vscode.commands.registerCommand(AppConstants.openInTextEditorCommand, () => {
  vscode.commands.executeCommand('workbench.action.reopenTextEditor', document?.uri);
});

and expose that command in the editor title context menu (package.json entry):

"editor/title": [
{
  "command": "resx-editor.openInTextEditor",
  "when": "activeCustomEditorId == 'resx-editor.editor' && activeEditorIsNotPreview == false",
  "group": "navigation@1"
}
...
]

Here’s the experience:

Toggle resx raw view

Helpful way to toggle back to the ‘raw’ view.

Using the custom editor as a previewer

But what if you are in the raw view and want to see the formatted one? This may be common for standard formats where users do NOT have your editor set as default. You can expose a preview mode for yours and similarly, expose a button on the editor to preview it. This is what I’ve done here in package.json:

"editor/title": [
...
{
  "command": "resx-editor.openPreview",
  "when": "(resourceExtname == '.resx' || resourceExtname == '.resw') && activeCustomEditorId != 'resx-editor.editor'",
  "group": "navigation@1"
}
...
]

And the command that is used to open a document in my specific editor:

let openInResxEditor = vscode.commands.registerCommand(AppConstants.openInResxEditorCommand, () => {

    const editor = vscode.window.activeTextEditor;

    vscode.commands.executeCommand('vscode.openWith',
        editor?.document?.uri,
        AppConstants.viewTypeId,
        {
            preview: false,
            viewColumn: vscode.ViewColumn.Active
        });
});

Now I’ve got a different ways to see the raw view, preview, or default structured custom view. 

Preview mode

Nice!

Check out the codez

As I mentioned earlier this is hardly an original idea, but I liked learning, using a standard UX and trying to make sure it felt like it fit within the VS Code experience.  So go ahead and give it an install and play around. It is not perfect and comes with the ‘works on my machine’ guarantee.

Marketplace listing

The code is out there and linked in the Marketplace listing for you.

| Comments

Whenever I work on something new, I like to make sure I try to better understand the tech and the ecosystem around it.  With the launch of the C# Dev Kit, I had to dive deeper into understanding some things about how VS Code extensions work, and get dirtier with TypeScript/JavaScript more than usual that my ‘day job’ required.  As a part of how I learn, I build.  So I went and built some new extensions.  Nearly all of my experiments are public on my repos, and all come with disclaimers that they usually are for completely selfish reasons (meaning they may not help anyone else but me – or just learning) or may not even be original ideas really.  I only say that because you may know a lot of this already.

As a part of this journey I’ve loved the VS Code extensibility model and documentation.  It really is great for 99% of the use cases (the remaining 1% being esoteric uses of WebView, some of the VS Code WebView UI Toolkit, etc).  And one thing I’ve come to realize is the subtleties of making your VS Code extension a lot more helpful to your consumers in the information, with very little effort – just some simple entries in package.json in fact.  Here were some that I wasn’t totally aware of (they are in the docs) mostly because my `yo code` starting point doesn’t emit them.  Nearly all of these exist to help people understand your extension, discover it, or interact with YOU better.  And they are simple!

The Manifest

First, make sure you understand the extension manifest is not just a package.json for node packages. It represents metadata for your Marketplace and some interaction with VS Code itself!

VS Code Extension Manifest

It’s just some snippet of text, but powers a few experiences…here are some I’ve noticed provide some added Marketplace and product value.

Repository

Sounds simple, but can be helpful if your extension is Open Source.  The repository just surfaces a specific link in your listing directly to your repository.

"repository": {
  "type": "git",
  "url": "https://github.com/timheuer/resx-editor"
}

Simple enough, you specify a type and to the root of your repo.

Bugs

You want people to log issues right?  This attribute powers the ‘Report Issue’ capability within VS Code itself:

VS Code Issue Reporter

To add this you simply put a URL to the issues collector of your project.  Could be anything really, but if it is a GitHub repo then your users will be able to directly log an issue from within VS Code. If it is not, then the URL of your issues collector (e.g., Jira, Azure DevOps) will be displayed here in link format.

"bugs": {
  "url": "https://github.com/timheuer/resx-editor/issues"
}

This is super helpful for your users and I think a requirement!

Q&A

By default if you publish to the Visual Studio Marketplace, then you get an Q&A tab for your extension. People can come here and start asking questions. I personally think the experience is not great here right now, as the publisher is the sole respondent, the conversation isn’t threaded, etc. But you can change that.

"qna": "https://github.com/timheuer/resx-editor/issues"

By adding this, the Q&A link in the marketplace will now direct people to your specific link here rather than bifurcate your Q&A discussions in marketplace and your chosen place. This can be GitHub Issues, GitHub Discussions, some other forum software, whatever. It provides a good entry point so that you don’t have to monitor yet another Q&A portion for your product.

Keywords

Yes you have categories (which are specific words that the Marketplace knows about), but you can also have keywords (up to 5). This is helpful when you basically want to add some searchable context/content that might not be in your title or brief description.

"keywords": [
  "resx",
  "resw",
  "resource",
  "editor",
  "viewer"
],

You can only have 5 so tune them well, but don’t leave these out.  They also display in the marketplace listing.

Badges

Who doesn’t love a good badge to show build status or versioning! One small delighter for the nerds among us is the Marketplace/manifest support this URL format from a set of approved badge providers.  Adding this in your manifest:

"badges": [
  {
    "url": "https://img.shields.io/visual-studio-marketplace/v/timheuer.resx-editor?label=VS%20Code%20Marketplace&color=brightgreen&logo=visualstudiocode",
    "href": "https://marketplace.visualstudio.com/items?itemName=TimHeuer.resx-editor",
    "description": "Current Version"
  },
  {
    "url": "https://github.com/timheuer/resx-editor/actions/workflows/build.yaml/badge.svg",
    "href": "https://github.com/timheuer/resx-editor/actions/workflows/build.yaml",
    "description": "Build Status"
  }
]

now shows these by default in your Marketplace listing:

VS Code Marketplace listing with badges

Maybe a bit ‘extra’ as my daughter would say, but I think it adds a nice touch.

Snippets

If you are a code provider or a custom editor you may want to add some snippets.  Your extension can directly contribute them with your other functionality.

"snippets": [
  {
    "language": "xml",
    "path": "./snippet/resx.json"
  }
]

Then when your extension is installed these are just a part of it and you don’t need to provide a ‘snippet only’ pack of sorts.

Menus

If you are doing custom things, you likely already know about contributing menus and commands.  But did you know that commands appear in the command palette by default? Perhaps you don’t want that as your command is context specific: only when a certain file type is open, a specific editor is in view, etc. So you’ll want to hide them by default in the command pallette using the ‘when’ clause like in lines 5 and 11 here. I want to never show one in the command palette (when:false) and the other only certain conditions when a specific view is open.

"menus": {
  "webview/context": [
    {
      "command": "resx-editor.deleteResource",
      "when": "config.resx-editor.experimentalDelete == true && webviewId == 'resx-editor.editor'"
    }
  ],
  "commandPalette": [
    {
      "command": "resx-editor.deleteResource",
      "when": "false"
    }
  ]
}

This enables the commands to be surfaced where you want like custom views, context menus, etc. without them showing as an ‘anytime’ available command.

Summary

There is a lot more you can do and of course the most important thing is providing a useful extension (heck, even if only to you). But these are some really simple and subtle changes I noticed in my learning that I think more extension authors should take advantage of!  Hope this helps!

| Comments

Well it was all about AI at Microsoft Build this year for sure…lots of great discussions and demos around GitHub Copilot, OpenAI, Intelligent Apps, etc.  I’ve been heavily relying on GitHub Copilot recently as I’ve been spending more time in writing VS Code extensions and I’m not as familiar with TypeScript.  Having that AI assistant with me *in the editor* has been amazing.

One of the sessions at Build was the keynote from Scott Guthrie where VP of Product, Amanda Silver, demonstrated building an OpenAI plugin for ChatGPT.  You can watch that demo starting at this timestamp as it was a part of the “Next generation AI for developers with the Microsoft Cloud” overall keynote.  It takes a simple API about products from the very famous Contoso outlet and exposes an API about products.  Amanda then created a plugin using Python and showed the workflow of getting this to work in ChatGPT.  So after a little prompting on Twitter and some change of weekend plans, I wanted to see what it would take to do this using ASP.NET Core API development.  Turns out it is pretty simple, so let’s dig in!

Working with ChatGPT plugins

A plugin in this case help connect the famous ChatGPT experience to third-party applications (APIs).  From the documentation:

These plugins enable ChatGPT to interact with APIs defined by developers, enhancing ChatGPT's capabilities and allowing it to perform a wide range of actions. For example, here is the Savvy Trader ChatGPT plugin in action where I can ask it investment questions and it becomes the responsible source for providing the data/answers to my natural language inquiry:

Screenshot of the Savvy Trader ChatGPT plugin

A basic plugin is a definition of a manifest that describe how ChatGPT should interact with the third-party API.  It’s a contract between ChatGPT, the plugin, and the API specification, using OpenAPI.  That’s it simply.  Could your existing APIs ‘just work’ as a plugin API? That’s something you’d have to consider before just randomly exposing your whole API surface area to ChatGPT. It makes more sense to be intentional about it and deliver a set of APIs that are meaningful to the AI model to look and receive a response.  With that said, we’ll keep on the demo/simple path for now.

For now the ChatGPT plugins require two sides: a ChatGPT Plus subscription to use them (plugins now available to all Plus subscribers) and to develop you need to be on the approved list, for which you must join the waitlist to develop/deploy a plugin (as of the date of this writing).

Writing the API

Now the cool thing for .NET developers, namely ASP.NET Core developers is writing your API doesn’t require anything new for you to learn…it’s just your code.  Can it be enhanced with more? Absolutely, but as you’ll see here, we are literally keeping it simple.  For ours we’ll start with the simple ASP.NET Core Web API template in Visual Studio (or `dotnet new webapi –use-minimal-apis`).  This gives us the simple starting point for our API.  We’re going to follow the same sample as Amanda’s so you can delete all the weather forecast sample information in Program.cs.  We’re going to add in some sample fake data (products.json) which we’ll load as our ‘data source’ for the API for now.  We’ll load that up first:

// get some fake data
List<Product> products = JsonSerializer.Deserialize<List<Product>>(File.ReadAllText("./Data/products.json"));

Observe that I have a Product class to deserialize into, which is pretty simple class that maps to the sample data…not terribly important for this reading.

Now we want to have our OpenAPI definition crafted a little, so we’re going to modify the Swagger definition a bit.  The template already includes Swashbuckle package to help us generate the OpenAPI specification needed…we just need to provide it with a bit of information.  I’m going to modify this to provide the title/description a bit better (otherwise by default it uses a set of project names you probably don’t want).

builder.Services.AddSwaggerGen(c =>
{
    c.SwaggerDoc("v1", new Microsoft.OpenApi.Models.OpenApiInfo() { Title = "Contoso Product Search", Version = "v1", Description = "Search through Contoso's wide range of outdoor and recreational products." });
});

Now we’ll add an API for products to query our data and expose that to OpenAPI definition:

app.MapGet("/products", (string? query = null) =>
{
    if (query != null) { 
        return products?.Where(p => p.Name.Contains(query, StringComparison.OrdinalIgnoreCase) || 
        p.Description.Contains(query, StringComparison.OrdinalIgnoreCase) || 
        p.Category.Contains(query, StringComparison.OrdinalIgnoreCase) ); 
    }

    return products;
})
.WithName("GetProducts")
.WithDescription("Get a list of products")
.WithOpenApi();

That’s it.  You can see the highlighted lines where we further annotate the endpoint for the OpenAPI specification. Now we have our API working and it will produce an OpenAPI spec by default at {host}/swagger/v1/swagger.yaml for us.  Note that you can further modify this location if you want providing a different route template in the Swagger config.

Now let’s move on to exposing this for ChatGPT plugins!

Exposing the API to ChatGPT

Plugins are enabled in ChatGPT by first providing a manifest that informs ChatGPT about what the plugin is, where the API definitions are, etc.  This is requested at a manifest located at {yourdomain}/.well-known/ai-plugin.json.  This is a well-known location and it is looking for a response that conforms to the schema.  Here are some advanced scenarios for authentication for a plugin, but we’ll keep it simple and expose this for all with no auth needed.  Details about the plugin manifest can be found here: ai-plugin.json manifest definition.  It’s a pretty simple file.  You probably will need a logo for your plugin of course – maybe use AI to generate that for you ;-).

There are a few ways you can expose this.  You can simply add a wwwroot folder, enable static files and drop the file in wwwroot\.well-known\ai-plugin.json.  To do that in your API project create the wwwroot folder, then create the .well-known folder (with the ‘.’) and put your ai-plugin.json file in that location.  If you go this approach you’ll want to ensure in your Program.cs you enable static files:

app.UseStaticFiles();

After you have all this in place you’ll need to enable CORS policy so that the ChatGPT can access your API correctly.  First you will need to enable CORS (line 1 in your builder) and then configure a policy for the ChatGPT domain (line 6 in the app):

builder.Services.AddCors();

...


app.UseCors(policy => policy
    .WithOrigins("https://chat.openai.com")
    .AllowAnyMethod()
    .AllowAnyHeader());

Now our API will be callable form the ChatGPT app.

Using Middleware to configure the manifest

As mentioned the static files approach for exposing the manifest is the simplest…but that’s no fun right?  We are developers!!! As I was looking at this myself, I put together a piece of ASP.NET middleware to help me configure it.  You can use the static files approach (in fact you’ll have to do that with your logo if hosting at the same place as your API) for sure, but just in case here’s a middleware approach that I put together.  First you’ll install the package TimHeuer.OpenAIPluginMiddleware from NuGet.  Once you’ve done that now you’ll add the service and tell the pipeline to use it.  First add it to the services of the builder (line 1) and then tell the app to use the middleware (line 15):

builder.Services.AddAiPluginGen(options =>
{
    options.NameForHuman = "Contoso Product Search";
    options.NameForModel = "contosoproducts";
    options.LegalInfoUrl = "https://www.microsoft.com/en-us/legal/";
    options.ContactEmail = "[email protected]";
    options.LogoUrl = "/logo.png";
    options.DescriptionForHuman = "Search through Contoso's wide range of outdoor and recreational products.";
    options.DescriptionForModel = "Plugin for searching through Contoso's outdoor and recreational products. Use it whenever a user asks about products or activities related to camping, hiking, climbing or camping.";
    options.ApiDefinition = new Api() { RelativeUrl = "/swagger/v1/swagger.yaml" };
});

...

app.UseAiPluginGen();

This might be overkill, but now your API will respond to /.well-known/ai-plugin.json automatically without having to use the static files manifest approach.  This comes in handy for any dynamic configuration of your manifest (and was the reason I created it).

Putting it together

With all this in place, now we go to ChatGPT (remember, need a Plus subscription) and add our plugin.  Since ChatGPT is a public site and we haven’t deployed our app yet to anywhere, we need to be able to have ChatGPT call it.  Visual Studio Dev Tunnels to the rescue!  If you haven’t heard about these yet, it is the fastest and most convenient way to get a public tunnel to your dev machine right from within Visual Studio!  In fact, this scenario is exactly what Dev Tunnels are for!  In our project we’ll create a tunnel first, and make it available to everyone (ChatGPT needs public access).  In VS first create a tunnel, you can do that easily from the ‘start’ button of your API in the toolbar:

Create a Dev Tunnel in Visual Studio

and then configure the options:

Dev Tunnel configuration screen

More details on these options are available at the documentation for Dev Tunnels, but these are the options I’m choosing.  Now once I have that the tunnel will be activated and when I run the project from within Visual Studio, it will launch under the Dev Tunnel proxy:

Screenshot of app running behind a public Dev Tunnel

You can see my app running, responding to the /.well-known/ai-plugin.json request and serving it from a public URL.  Now let’s make it known to ChatGPT…

First navigate to https://chat.openai.com and ensure you choose the GPT-4 approach then plugins:

Screenshot of the GPT-4 option on ChatGPT

Once there you will see the option to specify plugins in the drop-down and then navigate to the plugin store:

Plugin Store link

Click that and choose ‘Develop your own plugin’ where you will be asked to put in a URL.  This is where your manifest will respond to (just need the root URL).  Again, because this needs to be public, Visual Studio Dev Tunnels will help you! I put in the URL to my dev tunnel and click next through the process (because this is development you’ll see a few things about warnings etc):

Develop your own plugin

After that your plugin will be enabled and now I can issue a query to it and watch it work!  Because I’m using Visual Studio Dev Tunnels I can also set a breakpoint in my C# code and see it happening live, inspect, etc:

Breakpoint during debugging hit

A very fast way to debug my plugin before I’m fully ready for deployment!

Sample code

And now you have it.  Now you could actually deploy your plugin to Azure Container Apps for scale and you are ready to let everyone get recommendations on backpacks and hiking shoes from Contoso!  I’ve put all of this together (including some Azure deployment infrastructure scripts) in this sample repo: timheuer/openai-plugin-aspnetcore.  This uses the middleware that I created for the manifest.  That repo is located at timheuer/openai-plugin-middleware and I’d love to hear comments on the usefulness here. There is some added code in that repo that dynamically changes some of the routes to handle the Dev Tunnel proxy URL for development.

Hope this helps see the end to end of a very simple plugin using ASP.NET Core, Visual Studio, and ChatGPT with plugins!

| Comments

Okay, so I won’t quit my day job in favor of trying to come up with a witty title for a blog post.  But this is one thing that I’m proud to see our team deliver: one of the fastest ways to get your ASP.NET app to a container service on Azure (or elsewhere) without having to know what containers are or learn new things.  No really!

Cloud native

Well if you operate in the modern web world you’ve heard this term ‘cloud native’ before. And everyone has an opinion on what it means. I’m not here to pick sides and I think it means a lot of different things. One commonality it seems that most can agree on is that one aspect is of deploying a service to the cloud as ‘cloud native’ is to leverage containers.  If you aren’t familiar with containers, go read here: What is a container? It’s a good primer on what they are technically but also some benefits. Once you educate yourself you’ll be able to declare yourself worthy to nod your head in cloud native conversations and every once in a while throw out comments like “Yeah, containers will help here for us.” or something like that. Instantly you will be seen as smart and an authority and the accolades will start pouring in.  But then you may actually have to do something about it in your job/app. Hey don’t blame me, you brought this on yourself with those arrogant comments! Have no fear, Visual Studio is here to help!

Creating and deploying a container

If you haven’t spent time working with containers, you will be likely introduced to new concepts like Docker, Dockerfile, compose, and perhaps even YAML. In creating a container, you typically need to have a definition of what your container is, and generally this will be a Dockerfile.  A typical Docker file for a .NET Web API looks like this:

#See https://aka.ms/customizecontainer to learn how to customize your debug container and how Visual Studio uses this Dockerfile to build your images for faster debugging.

FROM mcr.microsoft.com/dotnet/aspnet:7.0 AS base
WORKDIR /app
EXPOSE 80
EXPOSE 443

FROM mcr.microsoft.com/dotnet/sdk:7.0 AS build
WORKDIR /src
COPY ["CommerceApi.csproj", "."]
RUN dotnet restore "./CommerceApi.csproj"
COPY . .
WORKDIR "/src/."
RUN dotnet build "CommerceApi.csproj" -c Release -o /app/build

FROM build AS publish
RUN dotnet publish "CommerceApi.csproj" -c Release -o /app/publish /p:UseAppHost=false

FROM base AS final
WORKDIR /app
COPY --from=publish /app/publish .
ENTRYPOINT ["dotnet", "CommerceApi.dll"]

You can see a few concepts here that you’d have to understand and that’s not the purpose of this post. You’d then need to use Docker to build this container image and also to ‘push’ it to a container registry like Azure Container Registry (ACR). For a developer this would mean you’d likely have Docker Desktop installed that brings these set of tools to you locally to execute within your developer workflow.  As you develop your solution, you’ll have to keep your Dockerfile updated if it involves more projects, version changes, path changes, etc. But what if you just have a simple service, you’ve heard about containers and you just want to get it to a container service as fast as possible and simple.  Well, in Visual Studio we have you covered.

Publish

Yeah yeah, ‘friends don’t let friends…’ – c’mon let people be (more on that later). In VS we have a great set of tools to help you rapidly get your code to various deployment endpoints. Since containers are ‘the thing’ lately as of this writing we want to help you remove concepts and get their fast as well…in partnership with Azure.  Azure has a new service launched last year called Azure Container Apps (ACA), a managed container environment that helps you scale your app. It’s a great way to get started in container deployments easily and have manageability and scale.  Let me show you how we help you get to ACA quickly, from your beloved IDE, with no need for a Dockerfile or other tools.  You’ll start with your ASP.NET Web project and start from the Publish flow (yep, right-click publish).  From their choose Azure and notice Azure Container Apps right there for you:

Visual Studio Publish dialog

After selecting that Visual Studio (VS) will help you either select existing resources that your infrastructure team helped setup for you or, if you’d like and have access to create them, create new Azure resources all from within VS easily without having to go to the portal.  You can then select your ACA instance:

Visual Studio Publish dialog with Azure

And then the container registry for your image:

Visual Studio Publish dialog with Azure

Now you’ll be presented with an option on how to build the container. Notice two options because we’re nice:

Publish with .NET SDK selection

If you still have a Dockerfile and want to go that route (read below) we enable that for you as well. But the first option is leveraging the .NET SDK that you already have (using the publish targets for the SDK). Selecting this option will be the ‘fast path’ to your publishing adventure.

Then click finish and you’re done, you now have a profile ready to push a container image to a registry (ACR), then to a container app service (ACA) without having to create a Docker file, learn a new concept or have other tools.  Click publish and you’ll see the completed results and you will now be able to strut back into your manager’s office/cube/open space bean bag and say Hey boss, our service is all containerized and in the cloud ready to scale…where’s my promo?

Publish summary page

VS has helped with millions of cloud deployments every month whether they be to VMs, PaaS services, Web Deploy to on-metal cloud-hosted machines, and now easily to container services like ACA.  It’s very helpful and fast, especially for those dev/test scenarios as you iterate on your app with others.

Leveraging continuous integration and deployment (CI/CD)

But Tim, friends don’t let friends right-click publish! Pfft, again I say, do what makes you happy and productive.  But also, I agree ;-).  Seriously though I’ve become a believer in CI/CD for EVERYTHING I do now, no matter the size of project. It just raises the confidence of repeatable builds and creates an environment of collaboration better for other things. And here’s the good thing, VS is going to help you bootstrap your efforts here easily as well – EVEN WITH CONTAINERS! Remember that step where we selected the SDK to build our container? Well if your VS project is within a GitHub repository (free for most cases these days, you should use it!), we’ll offer to generate an Actions workflow, which is GitHub’s CI/CD system:

Publish using CI/CD

In choosing a CI/CD workflow, the CI system (in this case GitHub Actions) needs to know some more information: where to deploy, some credentials to use for deployment, etc. The cool thing is even in CI, Visual Studio will help you do all of this setup including retrieving and setting these values as secrets on your repo! Selecting this option would result in this summary for you:

GitHub Actions summary page

And the resulting workflow in an Actions YAML file in your project:

name: Build and deploy .NET application to container app commerceapp
on:
  push:
    branches:
    - main
env:
  CONTAINER_APP_CONTAINER_NAME: commerceapi
  CONTAINER_APP_NAME: commerceapp
  CONTAINER_APP_RESOURCE_GROUP_NAME: container-apps
  CONTAINER_REGISTRY_LOGIN_SERVER: XXXXXXXXXXXX.azurecr.io
  DOTNET_CORE_VERSION: 7.0.x
  PROJECT_NAME_FOR_DOCKER: commerceapi
jobs:
  build:
    runs-on: ubuntu-latest
    steps:
    - name: Checkout to the branch
      uses: actions/checkout@v3
    - name: Setup .NET SDK
      uses: actions/[email protected]
      with:
        include-prerelease: True
        dotnet-version: ${{ env.DOTNET_CORE_VERSION }}
    - name: Log in to container registry
      uses: azure/docker-login@v1
      with:
        login-server: ${{ env.CONTAINER_REGISTRY_LOGIN_SERVER }}
        username: ${{ secrets.timacregistry_USERNAME_F84D }}
        password: ${{ secrets.timacregistry_PASSWORD_F84D }}
    - name: Build and push container image to registry
      run: dotnet publish -c Release -r linux-x64 -p:PublishProfile=DefaultContainer -p:ContainerImageTag=${{ github.sha }} --no-self-contained -p:ContainerRegistry=${{ env.CONTAINER_REGISTRY_LOGIN_SERVER }} -bl
    - name: Upload binlog for investigation
      uses: actions/upload-artifact@v3
      with:
        if-no-files-found: error
        name: binlog
        path: msbuild.binlog
  deploy:
    runs-on: ubuntu-latest
    needs: build
    steps:
    - name: Azure Login
      uses: azure/login@v1
      with:
        creds: ${{ secrets.commerceapp_SPN }}
    - name: Deploy to containerapp
      uses: azure/CLI@v1
      with:
        inlineScript: >
          az config set extension.use_dynamic_install=yes_without_prompt

          az containerapp registry set --name ${{ env.CONTAINER_APP_NAME }} --resource-group ${{ env.CONTAINER_APP_RESOURCE_GROUP_NAME }} --server ${{ env.CONTAINER_REGISTRY_LOGIN_SERVER }} --username ${{ secrets.timacregistry_USERNAME_F84D }} --password ${{ secrets.timacregistry_PASSWORD_F84D }}

          az containerapp update --name ${{ env.CONTAINER_APP_NAME }} --container-name ${{ env.CONTAINER_APP_CONTAINER_NAME }} --resource-group ${{ env.CONTAINER_APP_RESOURCE_GROUP_NAME }} --image ${{ env.CONTAINER_REGISTRY_LOGIN_SERVER }}/${{ env.PROJECT_NAME_FOR_DOCKER }}:${{ github.sha }}
    - name: logout
      run: >
        az logout

Boom! So now you CAN use right-click publish and still get started with CI/CD deploying to the cloud!  Strut right back into that office: Hey boss, I took the extra step and setup our initial CI/CD workflow for the container service so the team can just focus on coding and checking it in…gonna take the rest of the week off.

Cool, but I have advanced needs…

Now, now I know there will be always cases where your needs are different, this is too simple, etc. and YOU ARE RIGHT! There are limitations to this approach which we outlined in our initial support for the SDK container build capabilities.  Things like customizing your base container image, tag names, ports, etc. are all easily customizable in your project file as they feed into the build pipeline, so we have you covered on this type of customization. As your solution grows and your particular full microservices needs get more complex, you may outgrow this simplicity…we hope that means your app is hugely successful and profits are rolling in for your app! You’ll likely grow into the Dockerfile scenarios and that’s okay…you’ll have identified your needs and have already setup your starting CI/CD workflow that you can progressively also grow as needed. We will continue to listen and see about ways we can improve this capability as developers like you give us feedback!

Summary

Our goal in Visual Studio is to help you be productive with a range of tasks. Moving to ‘cloud native’ can be another thing that your team has to worry about and as you start your journey (or perhaps looking to simplify a bit) VS aims to be your partner there and continue to help you be productive in getting your code to the cloud quickly with as much friction removed from your normal workflow. Here’s a few links to read more in more corporate speak about these capabilities:

Thanks for reading!