| Comments

Today I was working on one of our internal GitHub repositories that apparently used to be used for our tooling issue tracking.  I have no idea the history but a quick look at the 68 issues with the latest dating back to 2017 told me that yeah, nobody is looking at these anymore.  After a quick email ack from my dev lead that I could bulk clear these out I immediately went to the repo issues list, and was about to do this:

Screenshot of mark all as closed

Then I realized that all that was going to do was close them without any reasoning at all.  I know that closing sends a notification to people on the issue and that wasn’t the right thing to do.  I quickly looked around, did some googling and didn’t find anything in the GitHub docs that would allow me to “bulk resolve and add a message” outside of adding a commit and a bunch of “close #XXX” statements.  That was unrealistic.  I threw it out on Twitter in hopes maybe someone had a tool already.  The other debate in my head was writing some code to iterate through them and close with a message.  This felt heavy for my needs, I’d need to get tokens, blah blah.  I’m lazy.

Then I thought to myself, Self, I’m pretty sure you should be able to use the ‘labeled’ trigger in GitHub Actions to automate this! Thinking this way made me think that I could use a trigger to still bulk close them but the action would be able to add a message to each one.  Again, a quick thinking here led me to be writing more code than I thought…but I was on the right track.  Some more searching for different terms (adding actions) and I discovered the action actions/stale to the rescue!  This is a workflow designed to run on a schedule, look at ‘stale’ (to be defined by you) and label them and/or close them after certain intervals.  The design looks to be something like “run every day and look for things that are X days old, label them stale, then warn that if action isn’t taken in Y days that they would be closed” – perfect for my need except I wanted to close NOW!  No problem.  Looking at the sample it used a schedule trigger and a CRON format for the schedule.  Off to crontab.guru to help me figure out the thing I can never remember.  What’s worse, regex or cron?  Who knows?

And then it dawned on me!  My favorite GitHub Actions tip is to add workflow_dispatch as one of the triggers to workflows.  This allows you to manually trigger a workflow from your repo:

Screenshot of manual workflow trigger

I use this ALL the time to make sure I can not have to fake a commit or something on certain projects.  This was the perfect thing I needed.  The combination of workflow_dispatch and this stale action would enable me to complete this quickly.  I added the following workflow to our repo:

name: "Close stale issues"
on:
  workflow_dispatch:
    branches:
    - master
    
jobs:
  stale:
    runs-on: ubuntu-latest
    steps:
    - uses: actions/[email protected]
      with:
        repo-token: ${{ secrets.GITHUB_TOKEN }}
        days-before-stale: 30
        days-before-close: 0
        stale-issue-message: 'This issue is being closed as stale'
        close-issue-message: 'This repo has been made internal and no longer tracking product issues. Closing all open stale issues.'

I just had to set a few parameters for a stale message (required) and I set the warning day basically to 0 so it would happen NOW.  Then I trigger the workflow manually.  Boom!  The workflow ran and 2 minutes later all 68 issues were marked closed with a message that serves as the reason and the user won’t be too alarmed for some random bulk closure.

Screenshot of GitHub message

I’m glad I remembered that GitHub Actions aren’t just for CI/CD uses and can be used to quickly automate much more.  In fact I’m writing this blog post maybe to help others, but certainly to serve as a bookmark to myself when I forget about this again.

Hope this helps!

| Comments

What the heck is a code analyzer?  Well if you are a Visual Studio user you probably have seen the lightbulbs and wrenches from time to time.  Put it simply in my own terms, code analyzers keep an eye on your code and find errors, suggest different ways of doing things, help you know what you aren’t using, etc.  Usually coupled with a code fix, an analyzer alerts you to an opportunity and a code fix can be applied to remedy that opportunity.  Here’s an example:

Screenshot of a code file with a code fix

These are helpful in your coding workflow (or intended to be!) to be more productive, learn some things along the way, or enforce certain development approaches.  This is an area of Visual Studio and .NET that part of my team works on and I wanted to learn more than beyond what they are generally.  Admittedly despite being on the team I haven’t had the first-hand experience of creating a code analyzer before so I thought, why not give it a try.  I fired up Visual Studio and got started without any help from the team (I’ll note in one step where I was totally stumped and needed a teammates help later).  I figured I’d write my experience in that it helps anyone or just serves as a bookmark for me for later when I totally forget all this stuff and have to do it again.  I know I’ve made some mistakes and I don’t think it’s fully complete, but it is ‘good enough’ so I’ll carry you on the journey here with me!

Defining the analyzer

First off we have to decide what we want to do.  There are a lot of analyzers already in the platform and other places, so you may not need one custom.  For me I had a specific scenario come up at work where I thought hmm, I wonder if I could build this into the dev workflow and that’s what I’m going to do.  The scenario is that we want to make sure that our products don’t contain terms that have been deemed inappropriate for various reasons.  These could be overtly recognized profanity, accessible terms, diversity-related, cultural considerations, etc. Either way we are starting from a place that someone has defined a list of these per policy.  So here is my requirements:

  • Provide an analyzer that starts from a specific set of known ‘database’ of terms in a structured format
  • Warn/error on code symbols and comments in the code
  • One analyzer code base that can provide different results for different severities
  • Provide a code fix that removes the word and fits within the other VS refactor/renaming mechnisms
  • Have a predictable build that produces the bits for anyone to easily consume

Pretty simple I thought, so let’s get started!

Getting started with Code Analyzer development

I did what any person would do and searched.  I ended up on a blog post from a teammate of mine who is the PM in this area, Mika titled “How to write a Roslyn Analyzer” – sounds like exactly what I was looking for! Yay team! Mika’s post help me understand the basics and get the tools squared away.  I knew that I had the VS Extensibility SDK workload installed already but wasn’t seeing the templates, so the post helped me realize that the Roslyn SDK is optional and I needed to go back and install that.  Once I did, I was able to start with File…New Project and search for analyzer and choose the C# template:

New project dialog from Visual Studio

This gave me a great starting point with 5 projects:

  • The analyzer library project
  • The code fix library project
  • A NuGet package project
  • A unit test project
  • A Visual Studio extension project (VSIX)

Visual Studio opened up the two key code files I’d be working with: the analyzer and code fix provider.  These will be the two things I focus on in this post.  First I recommend going to each of the projects and updating any/all NuGet Packages that have an offered update.

Analyzer library

Let’s look at the key aspects of the analyzer class we want to implement.  Here is the full template initially provided

public class SimpleAnalyzerAnalyzer : DiagnosticAnalyzer
{
    public const string DiagnosticId = "SimpleAnalyzer";
    private static readonly LocalizableString Title = new LocalizableResourceString(nameof(Resources.AnalyzerTitle), Resources.ResourceManager, typeof(Resources));
    private static readonly LocalizableString MessageFormat = new LocalizableResourceString(nameof(Resources.AnalyzerMessageFormat), Resources.ResourceManager, typeof(Resources));
    private static readonly LocalizableString Description = new LocalizableResourceString(nameof(Resources.AnalyzerDescription), Resources.ResourceManager, typeof(Resources));
    private const string Category = "Naming";

    private static readonly DiagnosticDescriptor Rule = new DiagnosticDescriptor(DiagnosticId, Title, MessageFormat, Category, DiagnosticSeverity.Warning, isEnabledByDefault: true, description: Description);

    public override ImmutableArray<DiagnosticDescriptor> SupportedDiagnostics { get { return ImmutableArray.Create(Rule); } }

    public override void Initialize(AnalysisContext context)
    {
        context.ConfigureGeneratedCodeAnalysis(GeneratedCodeAnalysisFlags.None);
        context.EnableConcurrentExecution();

        context.RegisterSymbolAction(AnalyzeSymbol, SymbolKind.NamedType);
    }

    private static void AnalyzeSymbol(SymbolAnalysisContext context)
    {
        var namedTypeSymbol = (INamedTypeSymbol)context.Symbol;

        // Find just those named type symbols with names containing lowercase letters.
        if (namedTypeSymbol.Name.ToCharArray().Any(char.IsLower))
        {
            // For all such symbols, produce a diagnostic.
            var diagnostic = Diagnostic.Create(Rule, namedTypeSymbol.Locations[0], namedTypeSymbol.Name);

            context.ReportDiagnostic(diagnostic);
        }
    }
}

A few key things to note here.  The DiagnosticId is what is reported to the errors and output.  You’ve probable seen a few of these that are like “CSC001” or stuff like that.  This is basically your identifier.  The other key area is the Rule here.  Each analyzer basically creates a DiagnosticDescriptor that it will produce and report to the diagnostic engine.  As you can see here and the lines below it you define it with a certain set of values and then indicate to the analyzer what SupportedDiagnostics this analyzer supports.  By the nature of this combination you can ascertain that you can have multiple rules each with some unique characteristics. 

Custom rules

Remember we said we wanted different severities and that is one of the differences in the descriptor so we’ll need to change that.  I wanted basically 3 types that would have different diagnostic IDs and severities.  I’ve modified my code as follows (and removing the static DiagnosticId):

private const string HtmlHelpUri = "https://github.com/timheuer/SimpleAnalyzer";

private static readonly DiagnosticDescriptor WarningRule = new DiagnosticDescriptor("TERM001", Title, MessageFormat, Category, DiagnosticSeverity.Warning, isEnabledByDefault: true, description: Description, helpLinkUri: HtmlHelpUri);
private static readonly DiagnosticDescriptor ErrorRule = new DiagnosticDescriptor("TERM002", Title, MessageFormat, Category, DiagnosticSeverity.Error, isEnabledByDefault: true, description: Description, helpLinkUri: HtmlHelpUri);
private static readonly DiagnosticDescriptor InfoRule = new DiagnosticDescriptor("TERM003", Title, MessageFormat, Category, DiagnosticSeverity.Info, isEnabledByDefault: true, description: Description, helpLinkUri: HtmlHelpUri);

public override ImmutableArray<DiagnosticDescriptor> SupportedDiagnostics { get { return ImmutableArray.Create(WarningRule, ErrorRule, InfoRule); } }

I’ve created 3 specific DiagnosticDescriptors and ‘registered’ them as supported for my analyzer.  I also added the help link which will show up in the UI in Visual Studio and if you don’t supply one you’ll get a URL that won’t be terribly helpful to your consumers.  Notice each rule has a unique diagnostic ID and severity.  Now we’ve got these sorted it’s time to move on to some of our logic.

Initialize and register

We have to decide when we want the analyzer to run and what it is analyzing.  I learned that once you have the Roslyn SDK installed you have available to you this awesome new tool called the Syntax Visualizer (View…Other Windows…Syntax Visualizer).  It let’s you see the view that Roslyn sees or what some of the old schoolers might consider the CodeDOM. 

Syntax Visualizer screenshot

You can see here that with it on and you click anywhere in your code the tree updates and tells you what you are looking at.  In this case my cursor was on Initialize() and I can see this is considered a MethodDeclarationSyntax type and kind.  I can navigate the tree on the left and it helps me discover what other code symbols I may be looking for to consider what I need my analyzer to care about.  This was very helpful to understand the code tree that Roslyn understands.  From this I was able to determine what I needed to care about.  Now I needed to start putting things together.

The first part I wanted to do is to register the compilation start action (remember I have intentions of loading the data from somewhere so I want this available sooner).  Within that I then have context to the analyzer and can ‘register’ actions that I want to participate in.  For this sample purposes I’m going to use RegisterSymbolAction because I just want specific symbols (as opposed to comments or full body method declarations).  I have to specify a callback to use when the symbol is analyzed and what symbols I care about.  In simplest form here is what the contents of my Initialize() method now looks like:

public override void Initialize(AnalysisContext context)
{
    context.ConfigureGeneratedCodeAnalysis(GeneratedCodeAnalysisFlags.None);
    context.EnableConcurrentExecution();

    context.RegisterCompilationStartAction((ctx) =>
    {
        // TODO: load the terms dictionary

        ctx.RegisterSymbolAction((symbolContext) =>
        {
            // do the work
        }, SymbolKind.NamedType, SymbolKind.Method, SymbolKind.Property, SymbolKind.Field,
                SymbolKind.Event, SymbolKind.Namespace, SymbolKind.Parameter);
    });
}

You can see that I’ve called RegisterCompilationStartAction from the full AnalysisContext and then called RegisterSymbolAction from within that, providing a set of specific symbols I care about.

NOTE: Not all symbols are available to analyzers.  I found that SymbolKind.Local is one that is not…and there was an analyzer warning that told me so!

Note that since I’m using a lambda approach here I removed the template code AnalyzeSymbol function from the class.  Okay, let’s move on to actually looking at the next step and load our dictionary.

Seeding the analyzer with data

I mentioned that we’ll have a dictionary of terms already.  This is a JSON file with a specific format that looks like this:

[
  {
    "TermID": "1",
    "Severity": "1",
    "Term": "verybad",
    "TermClass": "Profanity",
    "Context": "When used pejoratively",
    "ActionRecommendation": "Remove",
    "Why": "No profanity is tolerated in code"
  }
]

So the first thing I want to do is create a class that makes my life easier to work with this so I created Term.cs in my analyzer project.  The class basically is there to deserialize the file into strong types and looks like this:

using System.Text.Json.Serialization;

namespace SimpleAnalyzer
{
    class Term
    {
        [JsonPropertyName("TermID")]
        public string Id { get; set; }

        [JsonPropertyName("Term")]
        public string Name { get; set; }

        [JsonPropertyName("Severity")]
        public string Severity { get; set; }

        [JsonPropertyName("TermClass")]
        public string Class { get; set; }

        [JsonPropertyName("Context")]
        public string Context { get; set; }

        [JsonPropertyName("ActionRecommendation")]
        public string Recommendation { get; set; }

        [JsonPropertyName("Why")]
        public string Why { get; set; }
    }
}

So you’ll notice that I’m using JSON and System.Text.Json so I’ve had to add that to my analyzer project.  More on the mechanics of that much later.  I wanted to use this to make my life easier working with the terms database I needed to.

NOTE: Using 3rd party libraries (in this case System.Text.Json is considered one to the analyzer) requires more work and there could be issues depending on what you are doing.  Remember that analyzers run in the context of Visual Studio (or other tools) and there may be conflicts with other libraries.  It’s nuanced, so tred lightly.

Now that we have our class, let’s go back and load the dictionary file into our analyzer. 

NOTE:  Typically Analyzers and Source Generators use the concept called AdditionalFiles to load information.  This relies on the consuming project to have the file though and different than my scenario.  Working at the lower level in the stack with Roslyn, the compilers need to manage a bit more of the lifetime of files and such and so there is this different method of working with them.  You can read more about AdditionalFiles on the Roslyn repo: Using Additional Files (dotnet/roslyn).  This is generally the recommended way to work with files.

For us we are going to add the dictionary of terms *with* our analyzer so we need to do a few things.  First we need to make sure the JSON file is in the analyzer and also in the package output.  This requires us to mark the terms.json file in the Analyzer project as Content and to copy to output.  Second in the Package project we need to add the following to the csproj file in the _AddAnalyzersToOutput target:

<TfmSpecificPackageFile Include="$(OutputPath)\terms.json" PackagePath="analyzers/dotnet/cs" />

And then in the VSIX project we need to do something similar where we specify the NuGet packages to include:

<Content Include="$(OutputPath)\terms.json">
    <IncludeInVSIX>true</IncludeInVSIX>
</Content>

With both of these in place now we can get access to our term file in our Initialize method and we’ll add a helper function to ensure we get the right location.  The resulting modified Initialize portion looks like this:

context.RegisterCompilationStartAction((ctx) =>
{
    if (terms is null)
    {
        var currentDirecory = GetFolderTypeWasLoadedFrom<SimpleAnalyzerAnalyzer>();
        terms = JsonSerializer.Deserialize<List<Term>>(File.ReadAllBytes(Path.Combine(currentDirecory, "terms.json")));
    }
// other code removed for brevity in blog post
}

The helper function here is a simple one liner:

private static string GetFolderTypeWasLoadedFrom<T>() => new FileInfo(new Uri(typeof(T).Assembly.CodeBase).LocalPath).Directory.FullName;

This now gives us a List<Term> to work with.  These lines of code required us to add some using statements in the class that luckily an analyzer/code fix helped us do! You can see how helpful analyzers/code fixes are in your everyday usage and we take for granted!  Now we have our data, we have our action we registered for, let’s do some analyzing. 

Analyze the code

We basically want each symbol to do a search to see if it contains a word in our dictionary and if there is a match, then register a diagnostic rule to the user.  So given that we are using RegisterSymbolAction the context provides us with the Symbol and name we can examine.  We will look at that against our dictionary of terms, seeing if there is a match and then create a DiagnosticDescriptor for that in line with the severity of that match.  Here’s how we start:

ctx.RegisterSymbolAction((symbolContext) =>
{
    var symbol = symbolContext.Symbol;

    foreach (var term in terms)
    {
        if (ContainsUnsafeWords(symbol.Name, term.Name))
        {
            var diag = Diagnostic.Create(GetRule(term, symbol.Name), symbol.Locations[0], term.Name, symbol.Name, term.Severity, term.Class);
            symbolContext.ReportDiagnostic(diag);
            break;
        }
    }
}, SymbolKind.NamedType, SymbolKind.Method, SymbolKind.Property, SymbolKind.Field,
    SymbolKind.Event, SymbolKind.Namespace, SymbolKind.Parameter);

In this we are looking in our terms dictionary and doing a comparison.  We created a simple function for the comparison that looks like this:

private bool ContainsUnsafeWords(string symbol, string term)
{
    return term.Length < 4 ?
        symbol.Equals(term, StringComparison.InvariantCultureIgnoreCase) :
        symbol.IndexOf(term, StringComparison.InvariantCultureIgnoreCase) >= 0;
}

And then we have a function called GetRule that ensures we have the right DiagnosticDescriptor for this violation (based on severity).  That function looks like this:

private DiagnosticDescriptor GetRule(Term term, string identifier)
{
    var warningLevel = DiagnosticSeverity.Info;
    var diagId = "TERM001";
    var description = $"Recommendation: {term.Recommendation}{System.Environment.NewLine}Context: {term.Context}{System.Environment.NewLine}Reason: {term.Why}{System.Environment.NewLine}Term ID: {term.Id}";
    switch (term.Severity)
    {
        case "1":
        case "2":
            warningLevel = DiagnosticSeverity.Error;
            diagId = "TERM002";
            break;
        case "3":
            warningLevel = DiagnosticSeverity.Warning;
            break;
        default:
            warningLevel = DiagnosticSeverity.Info;
            diagId = "TERM003";
            break;
    }

    return new DiagnosticDescriptor(diagId, Title, MessageFormat, term.Class, warningLevel, isEnabledByDefault: true, description: description, helpLinkUri: HtmlHelpUri, term.Name);
}

In this GetRule function you’ll notice a few things.  First, we are doing this because we want to set the diagnostic ID and the severity differently based on the term dictionary data.  Remember earlier we created different rule definitions (DiagnosticDescriptors) and we need to ensure what we return here matches one of them.  This allows us to have one analyzer that tries to be a bit more dynamic.  We are also passing in a final parameter (term.Name) in the ctor for the DiagnosticDescriptor.  This is passed in the CustomTags parameter of the ctor.  We’ll be using this later in the code fix so we used this as a means to pass some context from the analyzer to the code fix (the term to replace).  The other part you’ll notice is that in the Diagnositc.Create method earlier we’re passing in some additional parameters as optional.  These get passed to the MessageFormat string that you’ve defined in your analyzer.  We didn’t mention it detail earlier but it comes in to play now.  The template gave us a Resources.resx file with three values:

Resource file contents

These are resources that are displayed in the outputs and Visual Studio user interface.  MessageFormat is one that enables you to provide some content into the formatter and that’s what we are passing here.  The result will be a more user-friendly message with the right context.  Great I think we have all our analyzer stuff working, let’s move on to the code fix!

Code fix library

With just the analyzer – which we are totally okay to only have – we have warnings/squiggles that will present to the user (or log in output).  We can optionally provide a code fix to remedy the situation.  In our simple sample here we’re going to do that and simply suggest to remove the word.  Code fixes also provide the user the means to suppress certain rules.  This is why we wanted different diagnostic IDs earlier as you may want to suppress the SEV3 terms but not the others.  Without that distinction/difference in DiagnosticDescriptors you cannot do that.  Moving over to the SimpleAnalyzer.CodeFixes project we’ll open the code fix provider and make some changes.  The default template provides a code fix to make the symbol all uppercase…we don’t want that but it provides a good framework for us to learn and make simple changes.  The first thing we need to do is tell the code fix provider what diagnostic IDs are fixable by this provider.  We make a change in the override provided by the template to provide our diagnostic IDs:

public sealed override ImmutableArray<string> FixableDiagnosticIds
{
    get { return ImmutableArray.Create("TERM001","TERM002","TERM003"); }
}

Now look in the template for MakeUppercaseAsync and let’s make a few changes.  First rename to RemoveTermAsync.  Then in the signature of that change it to include IEnumerable<string> so we can pass in those CustomTags we provided earlier from the analyzer.  You’ll also need to pass in those custom tags to the call to RemoveTermAsync.  Combined those look like these changes now in the template:

public sealed override async Task RegisterCodeFixesAsync(CodeFixContext context)
{
    var root = await context.Document.GetSyntaxRootAsync(context.CancellationToken).ConfigureAwait(false);

    // TODO: Replace the following code with your own analysis, generating a CodeAction for each fix to suggest
    var diagnostic = context.Diagnostics.First();
    var diagnosticSpan = diagnostic.Location.SourceSpan;

    // Find the type declaration identified by the diagnostic.
    var declaration = root.FindToken(diagnosticSpan.Start).Parent.AncestorsAndSelf().OfType<TypeDeclarationSyntax>().First();

    // Register a code action that will invoke the fix.
    context.RegisterCodeFix(
        CodeAction.Create(
            title: CodeFixResources.CodeFixTitle,
            createChangedSolution: c => RemoveTermAsync(context.Document, declaration, diagnostic.Descriptor.CustomTags, c),
            equivalenceKey: nameof(CodeFixResources.CodeFixTitle)),
        diagnostic);
}

private async Task<Solution> RemoveTermAsync(Document document, TypeDeclarationSyntax typeDecl, IEnumerable<string> tags, CancellationToken cancellationToken)
{
    // Compute new uppercase name.
    var identifierToken = typeDecl.Identifier;
    var newName = identifierToken.Text.Replace(tags.First(), string.Empty);

    // Get the symbol representing the type to be renamed.
    var semanticModel = await document.GetSemanticModelAsync(cancellationToken);
    var typeSymbol = semanticModel.GetDeclaredSymbol(typeDecl, cancellationToken);

    // Produce a new solution that has all references to that type renamed, including the declaration.
    var originalSolution = document.Project.Solution;
    var optionSet = originalSolution.Workspace.Options;
    var newSolution = await Renamer.RenameSymbolAsync(document.Project.Solution, typeSymbol, newName, optionSet, cancellationToken).ConfigureAwait(false);

    // Return the new solution with the now-uppercase type name.
    return newSolution;
}

With all these in place we now should be ready to try some things out.  Let’s debug.

Debugging

Before we debug remember we are using some extra libraries?  In order to make this work, your analyzer needs to ship those alongside.  This isn’t easy to figure out and you need to specify this in your csproj files to add additional outputs to your Package and Vsix projects.  I’m not going to emit them here, but you can look at this sample to see what I did.  Without this, the analyzer won’t start.  Please note if you are not using any 3rd party libraries then this isn’t required.  In my case I added System.Text.Json and so this is required.

I found the easiest way to debug was to set the VSIX project as the startup and just F5 that project.  This launches another instance of Visual Studio and installs your analyzer as an extension.  When running analyzers as extensions these do NOT affect the build.  So even though you may have analyzer errors, they don’t prevent the build from happening.  Installing analyzers as NuGet packages into the project would affect the build and generate build errors during CI, for example.  For now we’ll use the VSIX project to debug.  When it launches create a new project or something to test with…I just use a console application.  Remember when earlier I mentioned that the consumer project has to provide the terms dictionary?  It’s in this project that you’ll want to drop a terms.json file into the project in the format mentioned earlier.  This file also must be given the build action of “C# analyzer additional file” in the file properties.  Then let’s start writing code that includes method names that violate our rules.  When doing that we should now see the analyzer kick in and show the issues:

Screenshot of analyzer errors and warnings

Nice!  It worked.  One of the nuances of the template and the code fix is that I need to register a code action for each of the type of declaration that we had previously wanted the analyzer to work against (I think…still learning).  Without that the proper fix will not actually show/work if it isn’t the right type.  The template defaults are for NamedType, so my sample using method name won’t work on the fix, because it’s not the right declaration (again, I think…comment if you know).  I’ll have to enhance this later more, but the general workflow is working and if the type is named bad you can see the full end-to-end working:

Building it all in CI

Now let’s make sure we can have reproduceable builds of our NuGet and VSIX packages.  I’m using my quick template that I created for creating a simple workflow for GitHub Actions from the CLI and modifying a bit.  Because analyzers use VSIX, we need to use a Windows build agent that has Visual Studio on it and thankfully GitHub Actions provides one.  Here’s my resulting final CI build definition:

name: "Build"

on:
  push:
    branches:
      - main
    paths-ignore:
      - '**/*.md'
      - '**/*.gitignore'
      - '**/*.gitattributes'
  workflow_dispatch:
    branches:
      - main
    paths-ignore:
      - '**/*.md'
      - '**/*.gitignore'
      - '**/*.gitattributes'
      
jobs:
  build:
    if: github.event_name == 'push' && contains(toJson(github.event.commits), '***NO_CI***') == false && contains(toJson(github.event.commits), '[ci skip]') == false && contains(toJson(github.event.commits), '[skip ci]') == false
    name: Build 
    runs-on: windows-latest
    env:
      DOTNET_CLI_TELEMETRY_OPTOUT: 1
      DOTNET_SKIP_FIRST_TIME_EXPERIENCE: 1
      DOTNET_NOLOGO: true
      DOTNET_GENERATE_ASPNET_CERTIFICATE: false
      DOTNET_ADD_GLOBAL_TOOLS_TO_PATH: false
      DOTNET_MULTILEVEL_LOOKUP: 0
      PACKAGE_PROJECT: src\SimpleAnalyzer\SimpleAnalyzer.Package\
      VSIX_PROJECT: src\SimpleAnalyzer\SimpleAnalyzer.Vsix\

    steps:
    - uses: actions/[email protected]
      
    - name: Setup .NET Core SDK
      uses: actions/[email protected]
      with:
        dotnet-version: 5.0.x

    - name: Setup MSBuild
      uses: microsoft/[email protected]

    - name: Setup NuGet
      uses: NuGet/[email protected]

    - name: Add GPR Source
      run: nuget sources Add -Name "GPR" -Source ${{ secrets.GPR_URI }} -UserName ${{ secrets.GPR_USERNAME }} -Password ${{ secrets.GITHUB_TOKEN }}

    - name: Build NuGet Package
      run: |
        msbuild /restore ${{ env.PACKAGE_PROJECT }} /p:Configuration=Release /p:PackageOutputPath=${{ github.workspace }}\artifacts

    - name: Build VSIX Package
      run: |
        msbuild /restore ${{ env.VSIX_PROJECT }} /p:Configuration=Release /p:OutDir=${{ github.workspace }}\artifacts

    - name: Push to GitHub Packages
      run: nuget push ${{ github.workspace }}\artifacts\*.nupkg -Source "GPR"

    # upload artifacts
    - name: Upload artifacts
      uses: actions/[email protected]
      with:
        name: release-pacakges
        path: |
            ${{ github.workspace }}\artifacts\**\*.vsix
            ${{ github.workspace }}\artifacts\**\*.nupkg

I’ve done some extra work to publish this in the GitHub Package Repository but that’s just optional step and can be removed (ideally you’d publish this in the NuGet repository and you can learn about that by reading my blog post on that topic).  I’ve not got my CI set up and every commit builds the packages that can be consumed!  You might be asking what’s the difference between the NuGet and VSIX package.  The simple explanation is that you’d want people using your analyzer on the NuGet package because that is per-project and carries with the project, so everyone using the project gets the benefit of the analyzer.  The VSIX is per-machine and doesn’t affect builds, etc.  That may ideally be your scenario but it wouldn’t be consistent with everyone consuming the project that actually wants the analyzer.

Summary and resources

For me this was a fun exercise and distraction.  With some very much needed special assist from Jonathan Marolf on the team I learned a bunch and needed help on the 3rd party library thing mentioned earlier.  I’ve got a few TODO items to accomplish as I didn’t fully realize my goals.  The code fix isn’t working exactly how I want and would have thought, so I’m still working my way through this.  This whole sample by the way is on GItHub at timheuer/SimpleAnalyzer for you to use and point out my numerous mistakes of everything analyzer and probably C# even…please do!  In fact in my starting this and conversing with a few on Twitter, a group in Australia created something very similar that is already published on NuGet.  Check out merill/InclusivenessAnalyzer which aims to improve inclusivity in code.  The source like mine is up on GitHub and they have it published in the NuGet Gallery you can add to your project today!

There are a few resources you should look at if you want this journey yourself:

| Comments

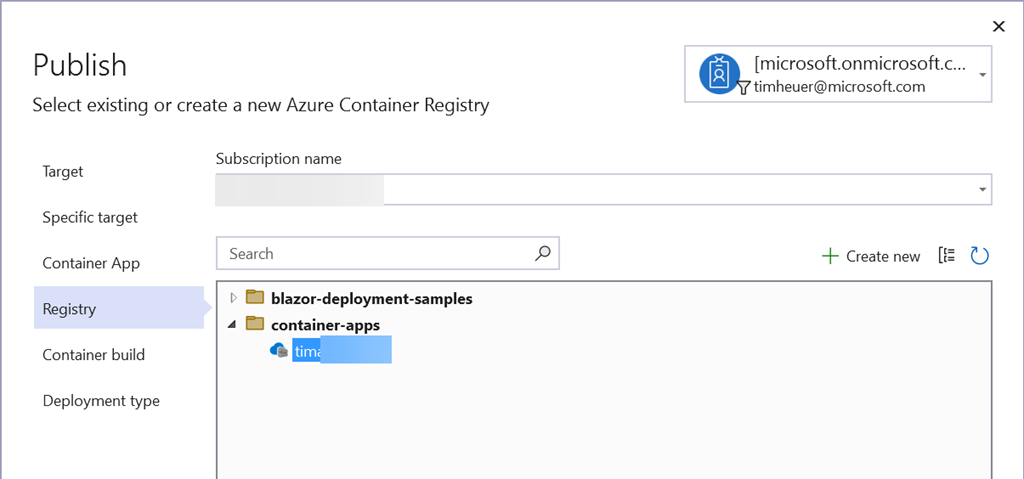
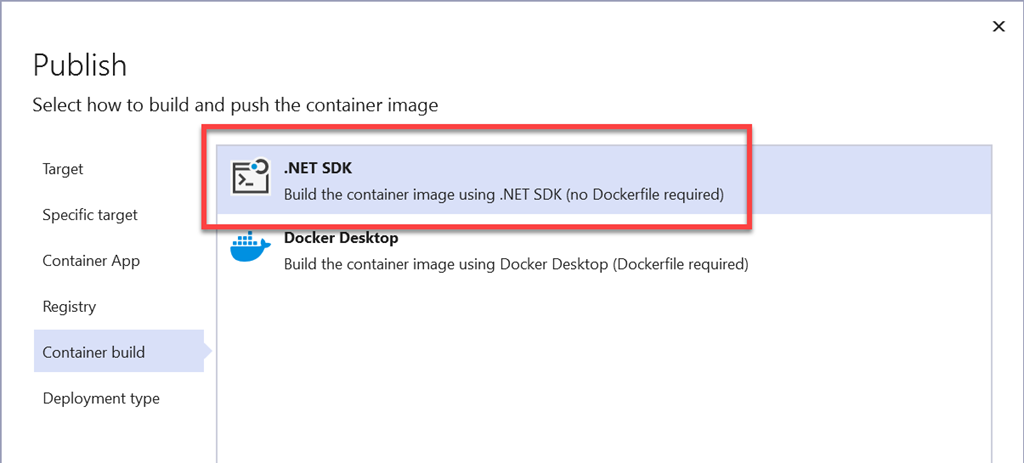
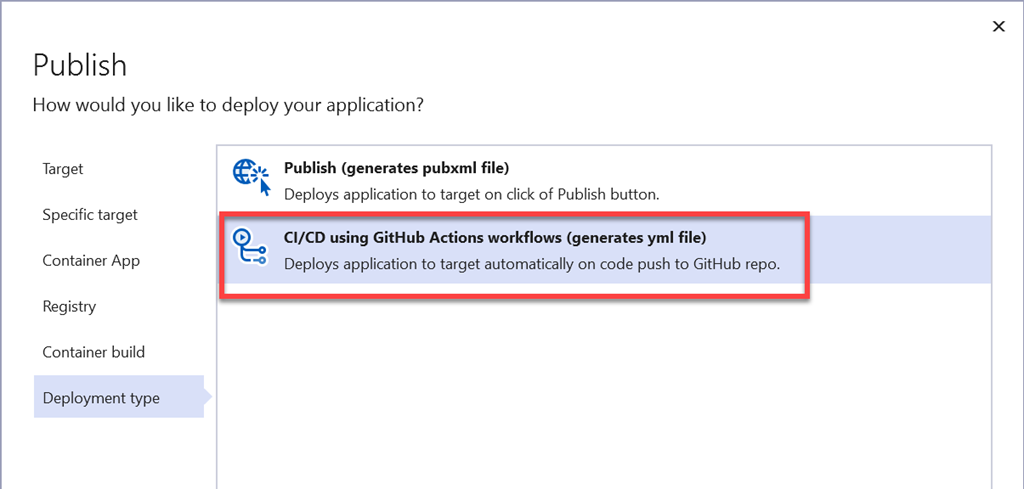
I’ve become a huge fan of DevOps and spending more time ensuring my own projects have a good CI/CD automation using GitHub Actions.  The team I work on in Visual Studio for .NET develops the “right click publish” feature that has become a tag line for DevOps folks (okay, maybe not in the post flattering way!).  We know that a LOT of developers use the Publish workflow in Visual Studio for their .NET applications for various reasons.  In reaching out to a sampling and discussing CI/CD we heard a lot of folks talking about they didn’t have the time to figure it out, it was too confusing, there was no simple way to get started, etc.  In this past release we aimed to improve that experience for those users of Publish to help them very quickly get started with CI/CD for their apps deploying to Azure.  Our new feature enables you to generate a GitHub Actions workflow file using the Publish wizard to walk you through it.  In the end you have a good getting started workflow.  I did a quick video on it to demonstrate how easy it is:

It really is that simple! 

Making it simple from the start

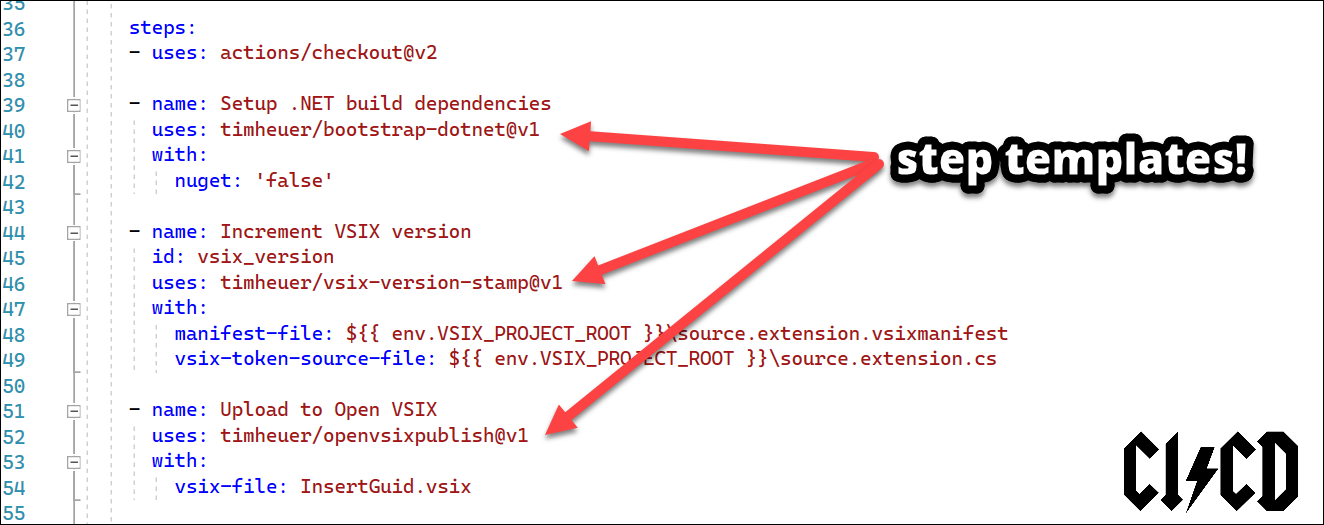
I have to admit though, as much as I have been doing this the YAML still is not sticking in my memory enough to type from scratch (dang you IntelliSense for making me lazy!).  There are also times where I’m not using Azure as my deployment but still want CI/CD to something like NuGet for my packages.  I still want that flexibility to get started quickly and ensure as my project grows I’m not waiting to the last minute to add more to my workflow.  I just saw Damian comment on this recently as well:

I totally agree!  Recently I found myself continuing to go to older repos to copy/paste from existing workflows I had.  Sure, I can do that because I’m good at copying/pasting, but it was just frustrating to switch context for even that little bit.  My searching may suck but I also didn’t see a quick solution to this either (please point out in my comments below if I missed a better solution!!!).  So I created a quick `dotnet new` way of doing this for my projects from the CLI.

Screenshot of terminal window with commands

I created a simple item template that can be called using the `dotnet new` command from the CLI.  Calling this in simplest form:

dotnet new workflow

will create a .github\workflows\foo.yaml file where you call it from (where ‘foo’ is the name of your folder) with the default content of a workflow for .NET Core that restores/builds/tests your project (using a default SDK version and ‘main’ as the branch).  You can customize the output a bit more with a command like:

dotnet new workflow --sdk-version 3.1.403 -n build -b your_branch_name

This will enable you to specify a specific SDK version, a specific name for the .yaml file, and the branch to monitor to trigger the workflow.  An example of the output is here:

name: "Build"

on:
  push:
    branches:
      - main
    paths-ignore:
      - '**/*.md'
      - '**/*.gitignore'
      - '**/*.gitattributes'
  workflow_dispatch:
    branches:
      - main
    paths-ignore:
      - '**/*.md'
      - '**/*.gitignore'
      - '**/*.gitattributes'
      
jobs:
  build:
    if: github.event_name == 'push' && contains(toJson(github.event.commits), '***NO_CI***') == false && contains(toJson(github.event.commits), '[ci skip]') == false && contains(toJson(github.event.commits), '[skip ci]') == false
    name: Build 
    runs-on: ubuntu-latest
    env:
      DOTNET_CLI_TELEMETRY_OPTOUT: 1
      DOTNET_SKIP_FIRST_TIME_EXPERIENCE: 1
      DOTNET_NOLOGO: true
      DOTNET_GENERATE_ASPNET_CERTIFICATE: false
      DOTNET_ADD_GLOBAL_TOOLS_TO_PATH: false
      DOTNET_MULTILEVEL_LOOKUP: 0

    steps:
    - uses: actions/[email protected]
      
    - name: Setup .NET Core SDK
      uses: actions/[email protected]
      with:
        dotnet-version: 3.1.x

    - name: Restore
      run: dotnet restore

    - name: Build
      run: dotnet build --configuration Release --no-restore

    - name: Test
      run: dotnet test

You can see the areas that would be replaced by some input parameters on lines 6,13,38 here in this example (these are the defaults).  This isn’t meant to be your final workflow, but as Damian suggests, this is a good practice to start immediately from your “File…New Project” aspect and build up the workflow as you go along, rather than wait until the end to cobble everything together.  For me, now I just need to add my specific NuGet deployment steps when I’m ready to do so.

Installing and feature wishes

If you find this helpful feel free to install this template from NuGet using:

dotnet new --install TimHeuer.GitHubActions.Templates

You can find the package at TimHeuer.GitHubActions.Templates which also has the link to the repo if you see awesome changes or horrible bugs.  This is a simple item template so there are some limitations that I wish it would do automatically.  Honestly I started out making a global tool that would solve some of these but it felt a bit overkill.  For example:

  • It adds the template from where you are executing.  Actions need to be in the root of your repo, so you need to execute this in the root of your repo locally.  Otherwise it is just going to add some folders in random places that won’t work. 
  • It won’t auto-detect the SDK you are using.  Not horrible, but would be  nice to say “oh, you are a .NET 5 app, then this is the SDK you need”

Both of these could be solved with more access to the project system and in a global tool, but again, they are minor in my eyes.  Maybe I’ll get around to solving them, but selfishly I’m good for now!

I just wanted to share this little tool that has become helpful for me, hope it helps you a bit!

| Comments

I was finally getting around to updating a little internal app I had that showed some various data that some groups use to triage bugs.  As you can imagine it is a classic “table of stuff” type dataset with various titles, numbers, IDs, etc. as visible columns.  I had built it using Blazor server and wanted to update it a bit.  In doing some of the updates I came across a preferred visual I liked for the grid view and applied the CASE methodology to implement that.  Oh you don’t know what CASE methodology is?  Copy Always, Steal Everything.  In this case the culprit was Immo on my team.  I know right? I couldn’t believe it either that he had something I wanted to take from a UI standpoint.  I digress…

In the end I wanted to provide a rendered table UI quickly and provide a global filter:

Picture of a filtered data table

Styling the table

I copied what I needed and realized I could be using the Bootstrap styles/tables in my use case.  Immo was using just <divs> but I own this t-shirt, so I went with <table> and plus, I like that Bootsrap had a nice example for me.  Off I went and changed my iteration loop. to a nice beautiful striped table.  Here’s what it looked like in the styling initially:

<table class="table table-striped">
    <thead class="thead-light">
        <tr>
            <th scope="col">Date</th>
            <th scope="col">Temp. (C)</th>
            <th scope="col">Temp. (F)</th>
            <th scope="col">Summary</th>
        </tr>
    </thead>
    <tbody>
        @foreach (var forecast in forecasts)
        {
            <tr>
                <td>@forecast.Date.ToShortDateString()</td>
                <td>@forecast.TemperatureC</td>
                <td>@forecast.TemperatureF</td>
                <td>@forecast.Summary</td>
            </tr>
        }
    </tbody>
</table>

Adding a filter

Now I wanted to add some filtering capabilities more globally.  Awesome “boostrap filtering” searching I went and landed on this simple tutorial.  Wow! a few lines of JavaScript, sweet, done.  Or so I thought.  As someone who hasn’t done a lot of SPA web app development I was quickly hit with the reality that once you choose a SPA framework (like Angular, React, Vue, Blazor) that you are essentially buying in to the whole philosophy and that for the most part jQuery-style DOM manipulations will no longer be at your fingertips as easily.  Sigh, off to some teammates I went to complain and look for their sympathy.  Narrator: they had no sympathy.

After another quick chat with Immo who had implementing the same thing he smacked me around and said in the most polite German accent “Why don’t you just use C# idiot?”  Okay, I added the idiot part, but I felt like he was typing it and then deleted that part before hitting send.  Knowing that Blazor renders everything and then re-renders when things change I just had to implement some checking logic in the foreach loop.  First I needed to add the filter input field:

<div class="form-group">
    <input class="form-control" type="text" placeholder="Filter..." 
           @bind="Filter" 
           @bind:event="oninput">
</div>
<table class="table table-striped">
...
</table>

Observe that I added an @bind and @bind:event attributes that enable me to wire these up to properties and client-side events.  So I’m telling it to bind the input to my ‘Field’ property and do this on ‘oninput’ (basically when the keys are typed in the input box).  Now off to implement the property.  I’m doing this simply in the @code block of the page itself:

@code {
    private WeatherForecast[] forecasts;

    protected override async Task OnInitializedAsync()
    {
        forecasts = await ForecastService.GetForecastAsync(DateTime.Now);
    }

    public string Filter { get; set; }
}

And then I needed to implement the logic for filtering.  I’m doing a global filter so that I can control whatever fields I want searched/filtered.  I basically have the IsVisible function called each iteration and deciding if it should be rendered.  For this sample I’m looking at if the summary contains the filter text or if the celsius or farenheit temperatures start with the digits being entered.  I actually have access to the item model so I could even filter off of something not visible if I wanted (which would be weird for your users, so you probably shouldn’t do that).  Here’s what I implemented:

public bool IsVisible(WeatherForecast forecast)
{
    if (string.IsNullOrEmpty(Filter))
        return true;

    if (forecast.Summary.Contains(Filter, StringComparison.OrdinalIgnoreCase))
        return true;

    if (forecast.TemperatureC.ToString().StartsWith(Filter) || forecast.TemperatureF.ToString().StartsWith(Filter))
        return true;

    return false;
}

Implementing the filter

Once I had the parameter, input event, and the logic, now I just needed to implement that in my loop.  A simple change to the foreach loop does the trick:

<table class="table table-striped">
    <thead class="thead-light">
        <tr>
            <th scope="col">Date</th>
            <th scope="col">Temp. (C)</th>
            <th scope="col">Temp. (F)</th>
            <th scope="col">Summary</th>
        </tr>
    </thead>
    <tbody>
        @foreach (var forecast in forecasts)
        {
            if (!IsVisible(forecast))
                continue;
            <tr>
                <td>@forecast.Date.ToShortDateString()</td>
                <td>@forecast.TemperatureC</td>
                <td>@forecast.TemperatureF</td>
                <td>@forecast.Summary</td>
            </tr>
        }
    </tbody>
</table>

Now when I type it automatically filters the view based on input.  Like a thing of beauty.  Here it is in action:

Animation of table being filtered

Pretty awesome.  While I’ve used the default template here to show this example, this technique can of course be applied to your logic.  I’ve put this in a repo to look at more detailed (this is running .NET 5-rc2 bits) at timheuer/BlazorFilteringWithBootstrap.

More advanced filtering

This was a simple use case and worked fine for me.  But there are more advanced use-cases, better user experiences to provide more logic to the filter (i.e., define your own contains versus equals, etc.) and that’s where 3rd party components come in.  There are a lot that provide built-in grids that have this capability.  Here are just a few:

Just to name a few popular ones.  These are all great components authored by proven vendors in the .NET component space.  These are way richer than simple filtering and provide a plethora of capabilities on top of grid-based rendering of large sets of data.  I recommend if you have those needs you check them out.

I’m enjoying my own journey writing Blazor apps and hope you found this dumb little sample useful.  If not, that’s cool.  I mainly am bookmarking here for my own use later when I forget and need to search…maybe I’ll find it back on my own site.

Hope this helps!

| Comments

At Build the Azure team launched a new service called Azure Static Web Apps in preview. This service is tailored for scenarios that really work well when you have a static web site front-end and using things like serverless APIs for your communication to services/data/etc. You should read more about it here: Azure Static Web Apps .

Awesome, so Blazor WebAssembly (Wasm) is a static site right? Can you use this new service to host your Blazor Wasm app? Let’s find out!

NOTE: This is just an experiment for me.  This isn’t any official stance of what may come with the service, but only what we can do now with Blazor apps.  As you see with Azure Static Web Apps there is a big end-to-end there with functions, debug experience, etc.  I just wanted to see if Blazor Wasm (as a static web app) could be pushed to the service.

As of this post the service is tailored toward JavaScript app development and works seamlessly in that setup. However, with a few tweaks (for now) we can get our Blazor app working. First we’ll need to get things setup!

Setting up your repo

The fundamental aspects of the service are deployment from your source in GitHub using GitHub Actions. So first you’ll need to make sure you have a repository on GitHub.com for your repository. I’m going to continue to use my Blazor Wasm Hosting Sample repo (which has different options as well to host Wasm apps) for this example. My app is the basic Blazor Wasm template, nothing fancy at all. Okay, we’ve got the repo set up, now let’s get the service setup.

Create the Azure Static Web App resource

You’ll need an Azure account of course and if you don’t have one, you can create an Azure account for free. Go ahead and do that and then come back here to make it easier to follow along. Once you have the account you’ll log in to the Azure portal and create a new resource using the Static Web App (Preview) resource type. You’ll see a simple form to fill out a few things like your resource group and a name for your app and the region.

Screenshot of Azure Portal configuration

The last thing there is where you’ll connect to your GitHub repo and make selections for what repo to use. It will launch you to authorize Azure Static Web Apps to make changes to your repo (for workflow and adding secrets):

Picture of GitHub permission prompt

Once authorized then more options show for the resource creation and just choose your org/repo/branch:

Picture of GitHub repo choices

Once you complete these selections, click Review+Create and the resource will create! The process will take a few minutes, but when complete you’ll have a resource with a few key bits of information:

Picture of finished Azure resource config

The URL of your app is auto-generated with probably a name that will make you chuckle a bit. Hey, it’s random, don’t try to make sense of it, just let the names like “icy cliff” inspire you. Additionally you’ll see the “Workflow file” YAML file and link. If you click it (go ahead and do that) it will take us over to your repo and the GitHub Actions workflow file that was created. We’ll take a look at the details next, but for now if you navigate to the Actions tab of your repo, you’ll see a fail. This is expected for us right now in our steps…more on that later.

Picture of workflows in Actions

In addition to the Actions workflow navigate to the settings tab of your repo and choose Secrets. You’ll see a new secret (with that random name) was added to your repo.

Picture of GitHub secrets

This is the API token needed to communicate with the service.

Why can’t you see the token itself and give the secret a different name? Great question. For now just know that you can’t. Maybe this will change, but this is the secret name you’ll have to use. It’s cool though, the only place it is used is in your workflow file. Speaking of that file, let’s take a look more in detail now!

Understanding and modifying the Action

So the initial workflow file was created and added to your workflow has all the defaults. Namely we’re going to focus on the “jobs” node of the workflow, which should start about line 12. The previous portions in the workflow define the triggers which you can modify if you’d like but they are intended to be a part of your overall CI/CD flow with the static site (automatic PR closure, etc.). Let’s look at the jobs as-is:

jobs:
  build_and_deploy_job:
    if: github.event_name == 'push' || (github.event_name == 'pull_request' && github.event.action != 'closed')
    runs-on: ubuntu-latest
    name: Build and Deploy Job
    steps:
    - uses: actions/[email protected]
    - name: Build And Deploy
      id: builddeploy
      uses: Azure/[email protected]
      with:
        azure_static_web_apps_api_token: ${{ secrets.AZURE_STATIC_WEB_APPS_API_TOKEN_ICY_CLIFF_XXXXXXXXX }}
        repo_token: ${{ secrets.GITHUB_TOKEN }} # Used for Github integrations (i.e. PR comments)
        action: 'upload'
        ###### Repository/Build Configurations - These values can be configured to match you app requirements. ######
        app_location: '/' # App source code path
        api_location: 'api' # Api source code path - optional
        app_artifact_location: '' # Built app content directory - optional
        ###### End of Repository/Build Configurations ######

Before we make changes, let’s just look. Oh see that parameter for api token? It’s using that secret that was added to your repo. GitHub Actions has built in a ‘secrets’ object that can reference those secrets and this is where that gets used. That is required for proper deployment. So there, that is where you can see the relationship to it being used!

This is great, but also was failing for our Blazor Wasm app. Why? Well because it’s trying to build it and doesn’t quite know how yet. That’s fine, we can help nudge it along! I’m going to make some changes here. First, change the checkout version to @v2 on Line 18. This is faster.

NOTE: I suspect this will change to be the default soon, but you can change it now to use v2

Now we need to get .NET SDK set up to build our Blazor app. So after the checkout step, let’s add another to first set up the .NET SDK we want to use. It will look like this, using the setup-dotnet action:

    - uses: actions/[email protected]
    
    - name: Setup .NET SDK
      uses: actions/[email protected]
      with:
        dotnet-version: 3.1.201

Now that we are setup, we need to build the Blazor app. So let’s add another step that explicitly builds the app and publish to a specific output location for easy reference in a later step!

    - uses: actions/[email protected]
    
    - name: Setup .NET SDK
      uses: actions/[email protected]
      with:
        dotnet-version: 3.1.201

    - name: Build App
      run: dotnet publish -c Release -o published

There, now we’ve got it building!

NOTE: I’m taking a bit of a shortcut in this tutorial and I’d recommend the actual best practice of Restore, Build, Test, Publish as separate steps. This allows you to more precisely see what is going on in your CI and clearly see what steps may fail, etc.

Our Blazor app is now build and prepared for static deployment in the location ‘published’ referenced in our ‘-o’ parameter during build. All the files we need start now at the root of that folder. A typical Blazor Wasm app published will have a web.config and a wwwroot at the published location.

Picture of Windows explorer folders

Let’s get back to the action defaults. Head back to the YAML file and look for the ‘app_location’ parameter in the action. We now want to change that to our published folder location, but specifically the wwwroot location as the root (as for now the web.config won’t be helpful). So you’d change it to look like this (a snippet of the YAML file)

    - uses: actions/[email protected]
    
    - name: Setup .NET SDK
      uses: actions/[email protected]
      with:
        dotnet-version: 3.1.201

    - name: Build App
      run: dotnet publish -c Release -o published

    - name: Build And Deploy
      id: builddeploy
      uses: Azure/[email protected]
      with:
        azure_static_web_apps_api_token: ${{ secrets.AZURE_STATIC_WEB_APPS_API_TOKEN_ICY_CLIFF_XXXXXXXXX }}
        repo_token: ${{ secrets.GITHUB_TOKEN }} # Used for Github integrations (i.e. PR comments)
        action: 'upload'
        ###### Repository/Build Configurations - These values can be configured to match you app requirements. ######
        app_location: 'published/wwwroot' # App source code path
        api_location: '' # Api source code path - optional
        app_artifact_location: 'published/wwwroot' # Built app content directory - optional
        ###### End of Repository/Build Configurations ######

This tells the Static Web App deployment steps to push our files from here. Go ahead and commit the workflow file back to your repository and the Action will trigger and you will see it complete:

Screenshot of completed workflow steps

We have now successfully deployed our Blazor Wasm app to the Static Web App Preview service! Now you’ll note that there is a lot of output in the Deploy step, including warnings about build warnings. For now this is okay as we are not relying on the service to build our app (yet). You’ll also see the note about Functions not being found (reminder we changed our parameter to not have that value). Let’s talk about that.

What about the Functions?

For now the service will automatically build a JavaScript app including serverless functions built using JavaScript in this one step. If you are a .NET developer you’ll most likely be building your functions in C# along with your Blazor front-end. Right now the service doesn’t automatically allow you to specify an API location in your project for C# function classes and automatically build them. Hopefully in the future we will see that be enabled. Until then you’ll have to deploy your functions app separately. You can do it in the same workflow though if it is a part of your same repo. You’ll just leverage the other Azure Functions GitHub Action to accomplish that. Maybe I should update my sample repo to also include that?

But wait, it is broken!

Well maybe you find out that the routing of URLs may not work all the time.  You’re right!  You need to supply a routes.json file located in your app’s wwwroot directory to provide the global rewrite rule so that URLs will always work.  The routes.json file should look like

{
  "routes": [
    {
      "route": "/*",
      "serve": "/index.html",
      "statusCode": 200
    }
  ]
}

and put in your source project’s wwwroot folder.  This will be picked up by the service and interpreted so routes work!

Considerations and Summary

So you’ve now seen it’s possible, but you should also know the constraints. I’ve already noted that you’ll need to deploy your Functions app separately and you have to build your Blazor app in a pre-step (which I think is a good thing personally), so you may be wondering why might you use this service. I’ll leave that answer to you as I think there are scenarios will it will be helpful and I do believe this is just a point in time for the preview and more frameworks hopefully will be supported. I know those of us on the .NET team are working with the service to better support Blazor Wasm, for example.

Another thing that Blazor build does for you is produce pre-compressed files for Brotli and Gzip compression delivered from the server. When you host Blazor Wasm using ASP.NET Core, we deliver these files to the client automatically (via middleware). When you host using Windows App Service you can supply a web.config to have rewrite rules that will solve this for you as well (you can in Linux as well). For the preview of the Static Web App service and Blazor Wasm, you won’t automatically get this, so your app size will be the default uncompressed sizes of the assemblies and static assets.

I hope that you can give the service a try with your apps regardless of if they are Blazor or not. I just wanted to demonstrate how you would get started using the preview making it work with your Blazor Wasm app. I’ve added this specific workflow to my Blazor Wasm Deployment Samples repository where you can see other forms as well on Azure to deploy the client app.

I hope this helps see what’s possible in preview today!